01June 18
Uzbekistan — Colombia
07:00 · Tashkent
23 630estimated visits
Share of total31.0%
SPECIAL REPORT
A map of 68 locations and approximately 76,000 estimated visits: how kickoff time, venue location, and audience profile shape the value of a citywide event for brands.
Total estimated visits
≈76.2thousandUzbekistan’s World Cup debut turned each national-team match into a distinct citywide media event.
During the broadcasts, fans gathered at stadiums, official fan zones, parks, schools, restaurants, and bars across Tashkent. METER analyzed anonymized geodata around 68 locations and showed how three matches created attention windows that differed in scale and character.
Estimated visits are an estimate, not a count of unique people.
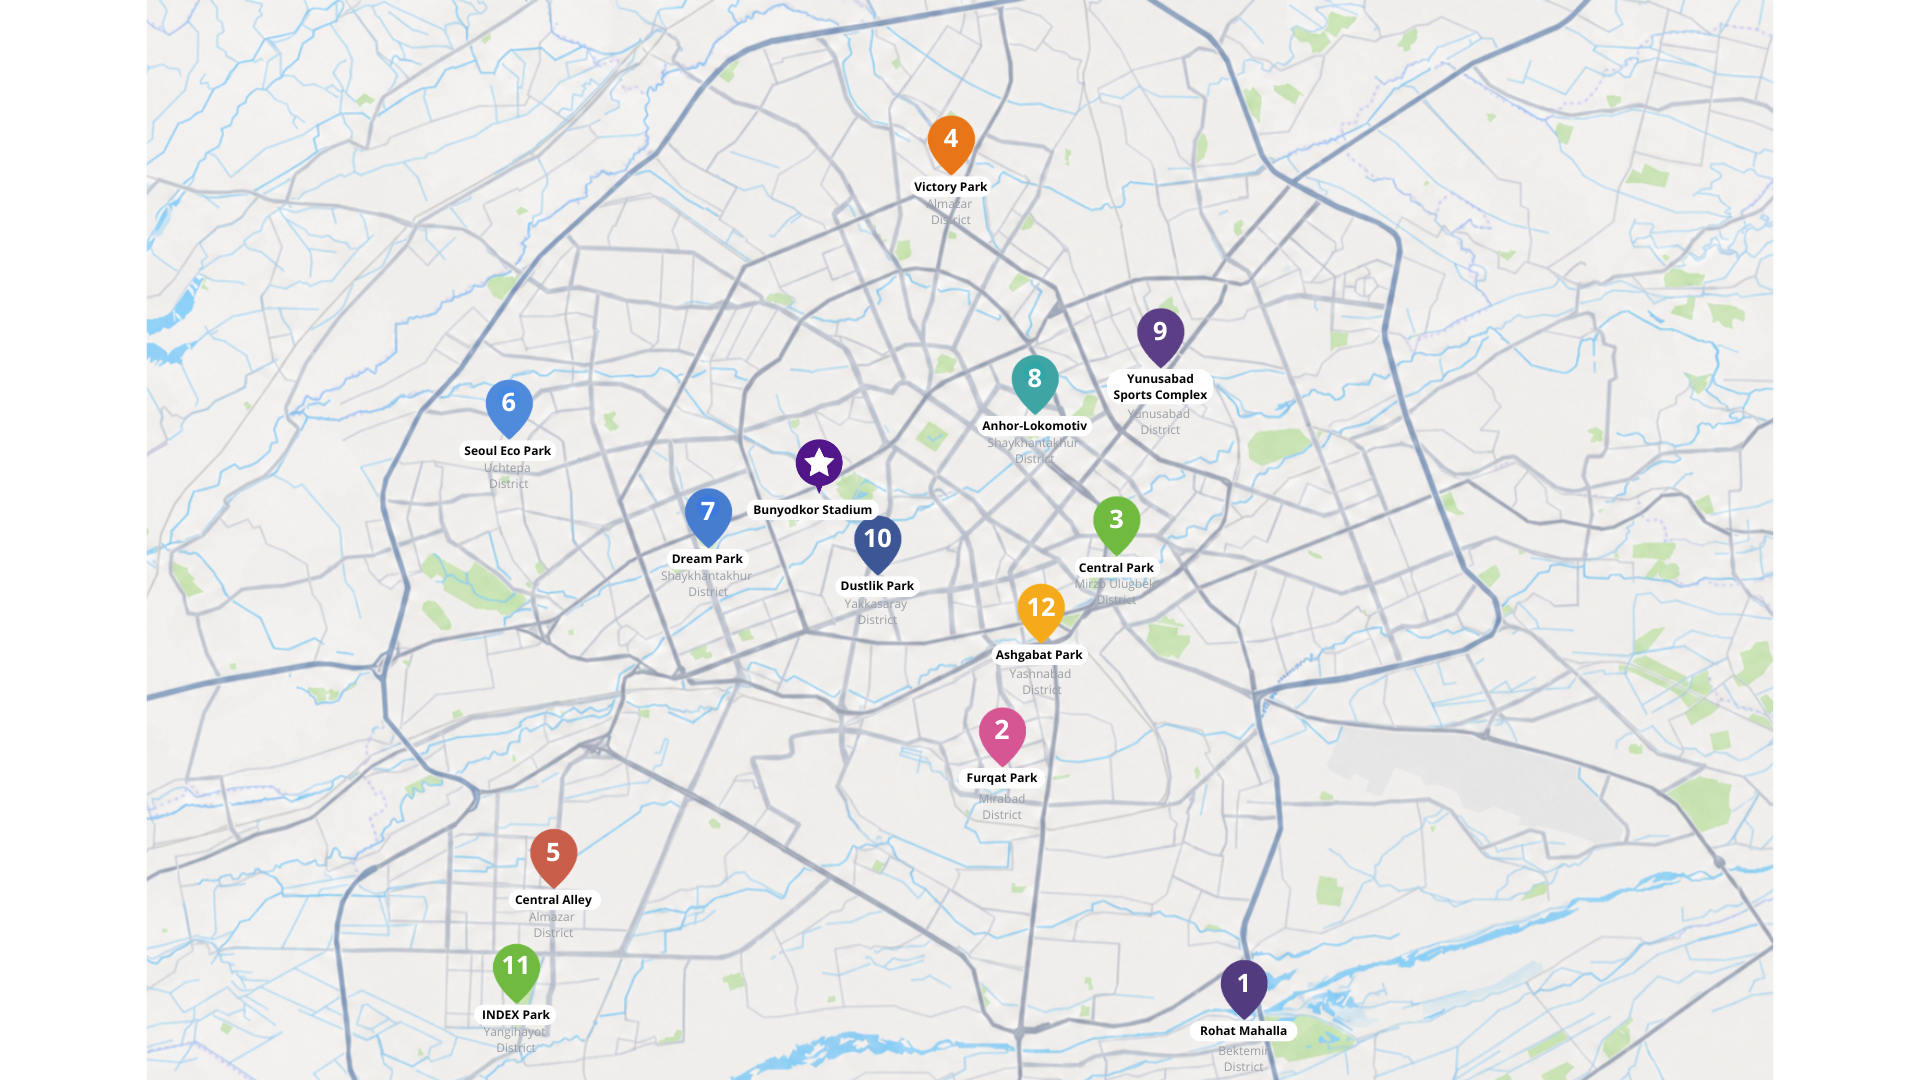
METER analyzed 68 collective viewing locations across the capital. The sample included official city fan zones, stadiums, sports complexes, parks, schools, restaurants, and bars.
The fan zone at Bunyodkor Stadium became the largest point of attraction. Yet the audience was distributed across the city: residents chose locations close to home, major public spaces, or venues where watching the match could be combined with other leisure activities.
METER treated each match not as part of one long football celebration, but as a distinct period of attention.
This matters for media planning: a tournament average hides the actual peaks and troughs that determine the potential volume of audience contact.
07:00 · Tashkent
22:00 · Tashkent
04:30 · Tashkent
More than half of all estimated visits came from the second match, Portugal versus Uzbekistan. That was more than the first and third matches combined. The 04:30 window drew the smallest audience, while the gap between the most and least attended matches exceeded fourfold. The causes cannot be isolated precisely, but the implication for advertisers is clear: the same event status does not produce the same volume of attention.
Collective viewing took place across Tashkent, but most of the audience was concentrated around a limited number of large locations. The scale of municipal fan zones explains their share, but does not make them the best solution in every case: a major venue delivers reach, while a local venue provides a clearer consumption context.
Rapid reach among a large event audience.
Narrower reach with a clearer consumption context.
The audience was predominantly, but not exclusively, male: 63.7% men and 36.3% women. Almost half were aged 30–49, while a further 25.8% were aged 18–29.
METER estimates that 50.2% of the audience belonged to the middle-income segment, 28.9% to the lower-income segment, and 20.9% to the higher-income segment.
AUDIENCE INTERESTS
The largest non-sport interests are tied to shopping, dining, and everyday consumption scenarios.
Interest categories may overlap, so the shares do not add up to 100%.
Interest in shopping makes match days relevant for retailers, marketplaces, and delivery services before, during, and after a broadcast.
Collective viewing creates a natural context for food, drinks, and shared leisure. Interest in restaurants reached 58.2%.
Relevant scenarios include in-venue payments, delivery, shopping, loyalty programs, and fan offers.
Automotive ranked second among audience interests. Both the audience profile and contact context depend on the venue type.
Connectivity, mobile internet, content, and communication within fan groups create product scenarios beyond conventional reach.
METER CAPABILITIES
METER analyzes audiences at urban events and spaces to identify where, when, and for which categories the most valuable contact occurs.
“A major event does not guarantee the same volume of attention by itself. Our data shows that one match can draw several times the audience of another, while different locations in the same city create different contact scenarios. Event-based placements should therefore be planned around the specific time, location, and audience profile.”
The second match generated more than half of all visits, a difference concealed by the tournament average.
A large fan zone delivers scale, but does not always align best with a brand’s objectives.
Shopping and restaurant interests show that the commercial potential extends beyond the football context.
Morning, evening, and overnight windows create different behavior and contact scenarios.
A brand’s product scenario can work harder than generic football imagery.
METER analyzed anonymized geodata within an approximately 100-meter radius of 68 collective viewing locations during three Uzbekistan national-team matches: June 18, 07:00–09:00; June 23, 22:00–24:00; and June 28, 04:30–06:30.
Audience profile and interests were calculated in aggregate. Visits are not a count of unique people and are not based on turnstile data. Interest categories may overlap and do not confirm purchases or other actions during the broadcasts.
Primary dataset: METER analysis of anonymized geodata and estimated visits across 68 locations in Tashkent, June 18–28, 2026.
CONCLUSION
The strongest window generated 55.7% of all estimated visits. The audience was predominantly male and adult, but its largest non-sport interests were shopping and restaurants. Within a football event, the audience remains relevant to multiple categories, while the value of contact changes from match to match, time to time, and venue to venue.
METER / AUDIENCE ANALYTICS
METER helps analyze footfall, audience profile, and interests across urban spaces — to choose the right locations, timing, and advertising inventory.